I have been trying to solve a blow-up with wetting and drying. The bathymetry has terrible metrics, according to the output:
Code: Select all
 Maximum grid stiffness ratios:  rx0 =   1.960000E+02 (Beckmann and Haidvogel)
                                 rx1 =   1.466021E+04 (Haney)
However, I don't think this is the problem. For one thing, I am not sure these metrics are correct when used with bathymetry with both positive and negative values. (This is the Teignmouth case, with tide range of >4 m). I have added constant offset to the depth (to make it all positive), smoothed the bathymetry to a maximum rx0 of 0.3 (using Mathieu's LP_Bathymetry package), and then removed the offset. Mathieu's GRID_RoughnessMatrix.m file returns max rx0 of 0.3 when the offset is added, but approaches ~200 after the offset is removed, mostly on the edges of the estuary channel. Anyway, I don't think that is the problem, because the blow-up is not associated with the steeper parts of the bathy grid, it is on one of the flanking sandbars. Also, the model blew up at exactly the same spot and time step AFTER smoothing the bathymetry, which makes me think that is not the problem.
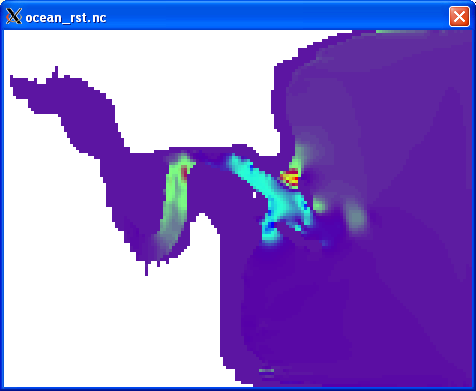
It appears as a NaN in u and v at the margin of a cell that is going dry. (White spot in ncview image).

- teign_ocean_rst_v.png (12.8 KiB) Viewed 6894 times
I am doing a run with a changed tiling scheme and an increased Dcrit to see if that changes things. Any other suggestions?